Oregon by the Numbers
Trusted data for your community
Our annual Oregon by the Numbers report features detailed profiles of all 36 counties as well as measures of community well-being, with rural and urban comparisons when available. Our goal is to help all of Oregon see all of Oregon and to make information readily accessible and actionable.
Get your copy
We offer a printed version of the report in even years, and in odd-numbered years we refresh the data online. Download a copy today and learn about the community you call home. Printed copies of the report are on their way for those who preordered!
Download Oregon by the Numbers 2026 PDF
Baje la edición de Oregon by the Numbers 2026 en español PDF
Questions about Oregon by the Numbers? Encountering an accessibility issue with the resource? Please reach out to obtn@tfff.org.
Past editions are available below.

Download county profiles
Click the interactive map to view and download individual county profiles in English or Spanish.
County profiles highlight data for all of Oregon’s 36 counties. From population demographics to data about households experiencing financial hardship to top employment industries, county profile pages give readers an at-a-glance, visual way to learn about their county.

Download county profiles
Visit this page on a desktop browser to view and download individual county profiles.
County profiles highlight data for all of Oregon’s 36 counties. From population demographics to data about households experiencing financial hardship to top employment industries, county profile pages give readers an at-a-glance, visual way to learn about their county.
10,000+
Oregon by the Numbers reports distributed

40 indicators
of community well-being

36 counties
in Oregon have unique data profiles
A spotlight on Oregon kids
Child care
Hover over the interactive map to view rates for each Oregon county.
All 36 Oregon counties are considered child care deserts, which means for every regulated child care slot, there are at least three children who might fill it. As a result, many families across Oregon cannot find care for their children.
Five-year high school graduation rate
Hover over the interactive map to view rates for each Oregon county.
High school graduation rate indicates a community’s well-being as well as the skill of its workforce. Over the last few decades, the gap in wages between those with a high school diploma and those without one has provided strong incentive for students to complete high school. Still, across Oregon, a significant group of students require more time to graduate.

Child care
All 36 Oregon counties are considered child care deserts, which means for every regulated child care slot, there are at least three children who might fill it. As a result, many families across Oregon cannot find care for their children. Visit this page from a desktop computer to view rates for each Oregon county.
Five-year high school graduation rate
High school graduation rate indicates a community’s well-being as well as the skill of its workforce. Over the last few decades, the gap in wages between those with a high school diploma and those without one has provided strong incentive for students to complete high school. Still, across Oregon, a significant group of students require more time to graduate. Visit this page from a desktop computer to view rates for each Oregon county.

Issue archive

2025 edition
Download PDF
Baje la edición PDF
2024 edition
Download PDF
Baje la edición PDF
Editions dating back to 2018
2023

2023 edition
Download PDF
Baje la edición PDF
2022
2022 edition
Download PDF
Baje la edición PDF
2021
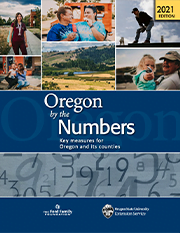
2021 edition
Download PDF
Baje la edición PDF
2020
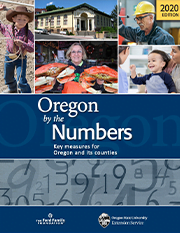
2020 edition
Download PDF
2019
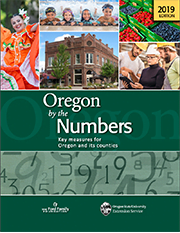
2019 edition
Download PDF
2018
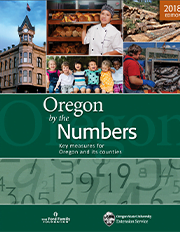
2018 edition
Download PDF
Subscribe to Oregon by the Numbers